← Back to Projects
Sales Analysis Dashboard
Interactive Power BI dashboard for sales analytics using SQL and AdventureWorks dataset
Project Overview
A comprehensive business intelligence dashboard designed to provide real-time insights into sales performance, regional trends, and product analytics. This project demonstrates end-to-end BI implementation from data extraction to interactive visualization.
Key Focus: Creating actionable insights through interactive dashboards and strategic metrics.
Project Objectives
- 📊 Real-time Sales Monitoring: Track sales metrics and KPIs in real-time
- 🎯 Performance Analysis: Analyze sales performance by region, product, and customer
- 📈 Trend Identification: Identify sales trends and seasonal patterns
- 💡 Business Insights: Provide actionable insights for strategic decision-making
- 🔍 Interactive Exploration: Allow stakeholders to drill down and explore data
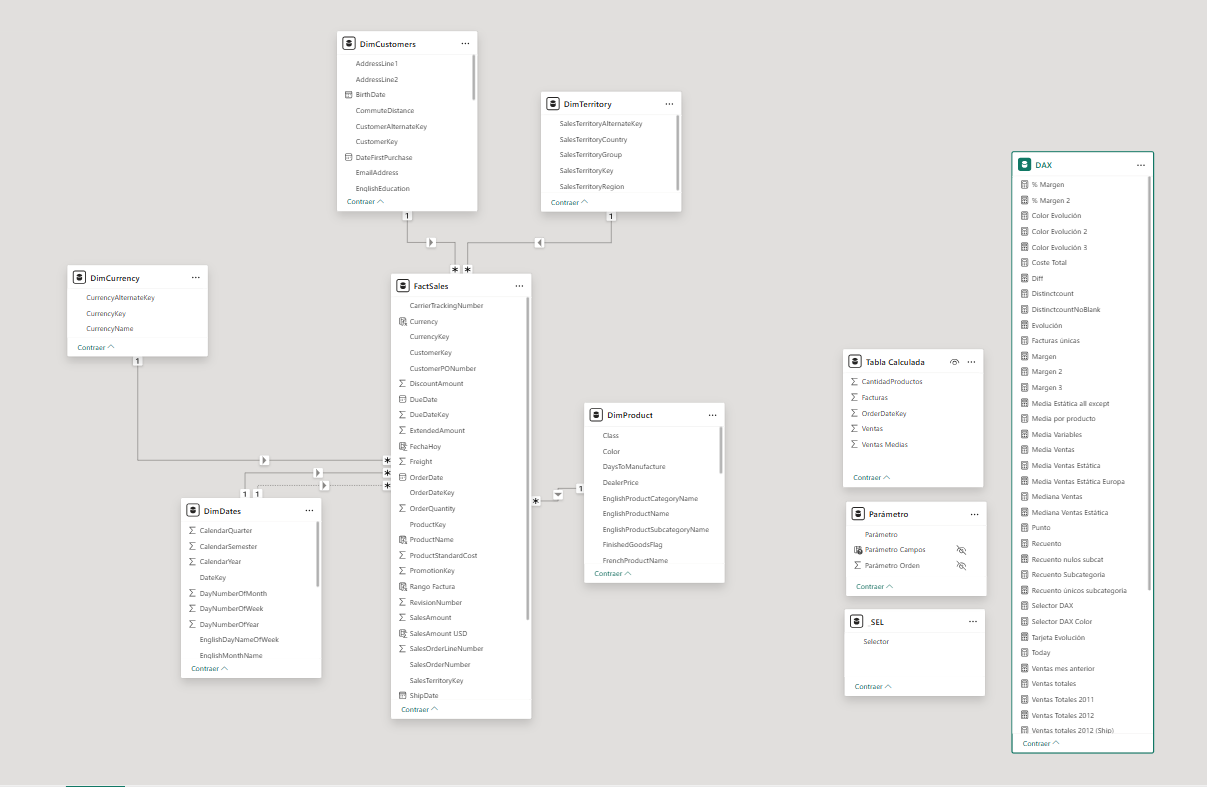
Data Model
Data Sources
- Primary Dataset: AdventureWorks OLTP Database
- Tables Used:
Sales.SalesOrderHeader- Order transactionsSales.SalesOrderDetail- Order line itemsSales.Customer- Customer informationSales.SalesTerritory- Regional dataProduction.Product- Product detailsProduction.ProductCategory- Product hierarchy
Data Model Structure
Technologies Used
BI & Visualization
- Power BI Desktop - Dashboard development
- Power Query - Data transformation
- DAX (Data Analysis Expressions) - Calculations and measures
Data
- AdventureWorks Sample Database - OLTP dataset
- Fact & Dimension Tables - Star schema design
- Date Dimension - Time intelligence
Dashboard Features
1. Executive Summary
- High-level KPIs (Total Sales, Orders, Customers)
- Year-to-Date metrics with targets
- Sales trend visualization
- Regional performance overview
2. Sales Analysis
- Sales by product category
- Sales by territory/region
- Sales by customer segment
- Top 10 products performance
- Sales trend over time
3. Regional Performance
- Sales by territory heatmap
- Regional comparison metrics
- Territory-level drill-down capability
- Regional growth trends
4. Product Analytics
- Product category performance
- Best-selling products
- Product profitability
- Product trend analysis
- Inventory insights
5. Interactive Filters
- Date range selector
- Territory/Region filter
- Product category filter
- Customer segment filter
- Year/Month/Quarter selection
Screenshots
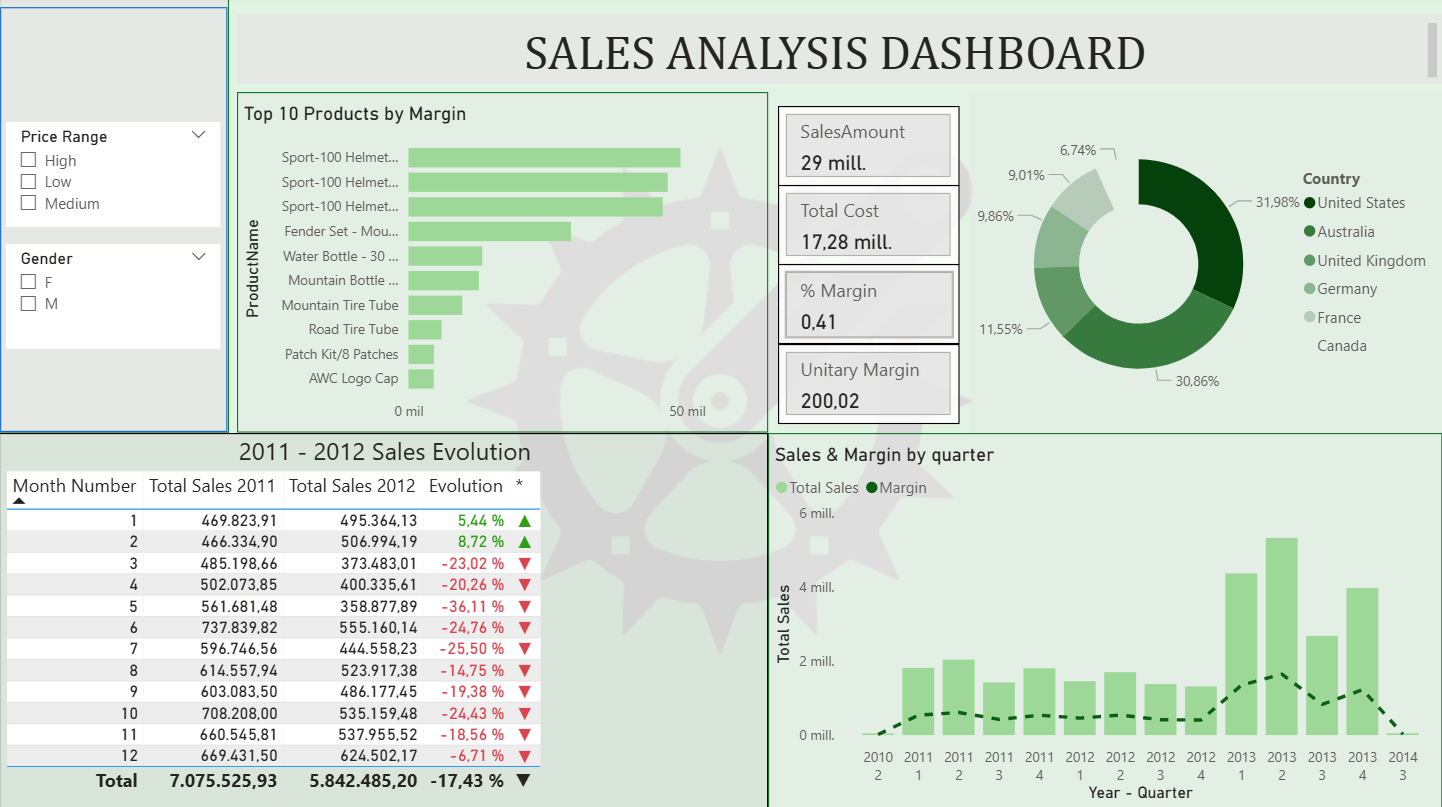
[Screenshot 1: Sales Summary]
KPIs displayed at the top with key metrics
DAX Formulas
Measure: Total Sales
TotalSales = SUMX(
    FactSales,
    FactSales[Quantity] * FactSales[UnitPrice]
)
Measure: Sales YoY Growth
SalesYoY = VAR CurrentYear = YEAR(TODAY())
RETURN
    CALCULATE(
        [TotalSales],
        YEAR(FactSales[OrderDate]) = CurrentYear
    )
Measure: Average Order Value
AvgOrderValue = DIVIDE(
    [TotalSales],
    DISTINCTCOUNT(FactSales[OrderID]),
    0
)
Measure: Month-over-Month Growth
MoMGrowth = VAR CurrentMonth = [TotalSales]
    VAR PreviousMonth = CALCULATE(
        [TotalSales],
        DATEADD(DimDate[Date], -1, MONTH)
    )
RETURN
    DIVIDE(CurrentMonth - PreviousMonth, PreviousMonth, 0)
Business Insights
Key Findings
- Sales Concentration
- Top 20% of products generate 80% of revenue
- Regional variations in product preferences
- Seasonal patterns observed in Q4
- Customer Behavior
- Average customer lifetime value: [Value]
- Repeat purchase rate: [%]
- Customer acquisition cost: [Value]
- Growth Opportunities
- Emerging product categories showing growth
- Underperforming regions with potential
- Cross-selling opportunities identified
- Performance Metrics
- Quarter-over-quarter growth: [%]
- Customer satisfaction metrics: [Value]
- Order fulfillment rate: [%]
Repository & Links
📁 GitHub Repository: [Link to Repository]